
Knowledge is Power,
Made Visible.
Infographics transform complex information into visuals that are clear, engaging, and easy to understand. For me, the goal is always to turn data into a story — using icons, charts, and illustrations to highlight what matters most. Whether for education, marketing, or technical reports, well-crafted infographics make knowledge accessible and memorable.


Infographics for
Technological Concepts
Always On, Always Connected PC. I took on the challenge of illustrating ARM's 'Always On, Always Connected PC' technology evolution. My infographic condensed data into a cohesive visual that embodied ARM's brand identity, playing a central role on our website and in presentations, effectively conveying this groundbreaking concept.
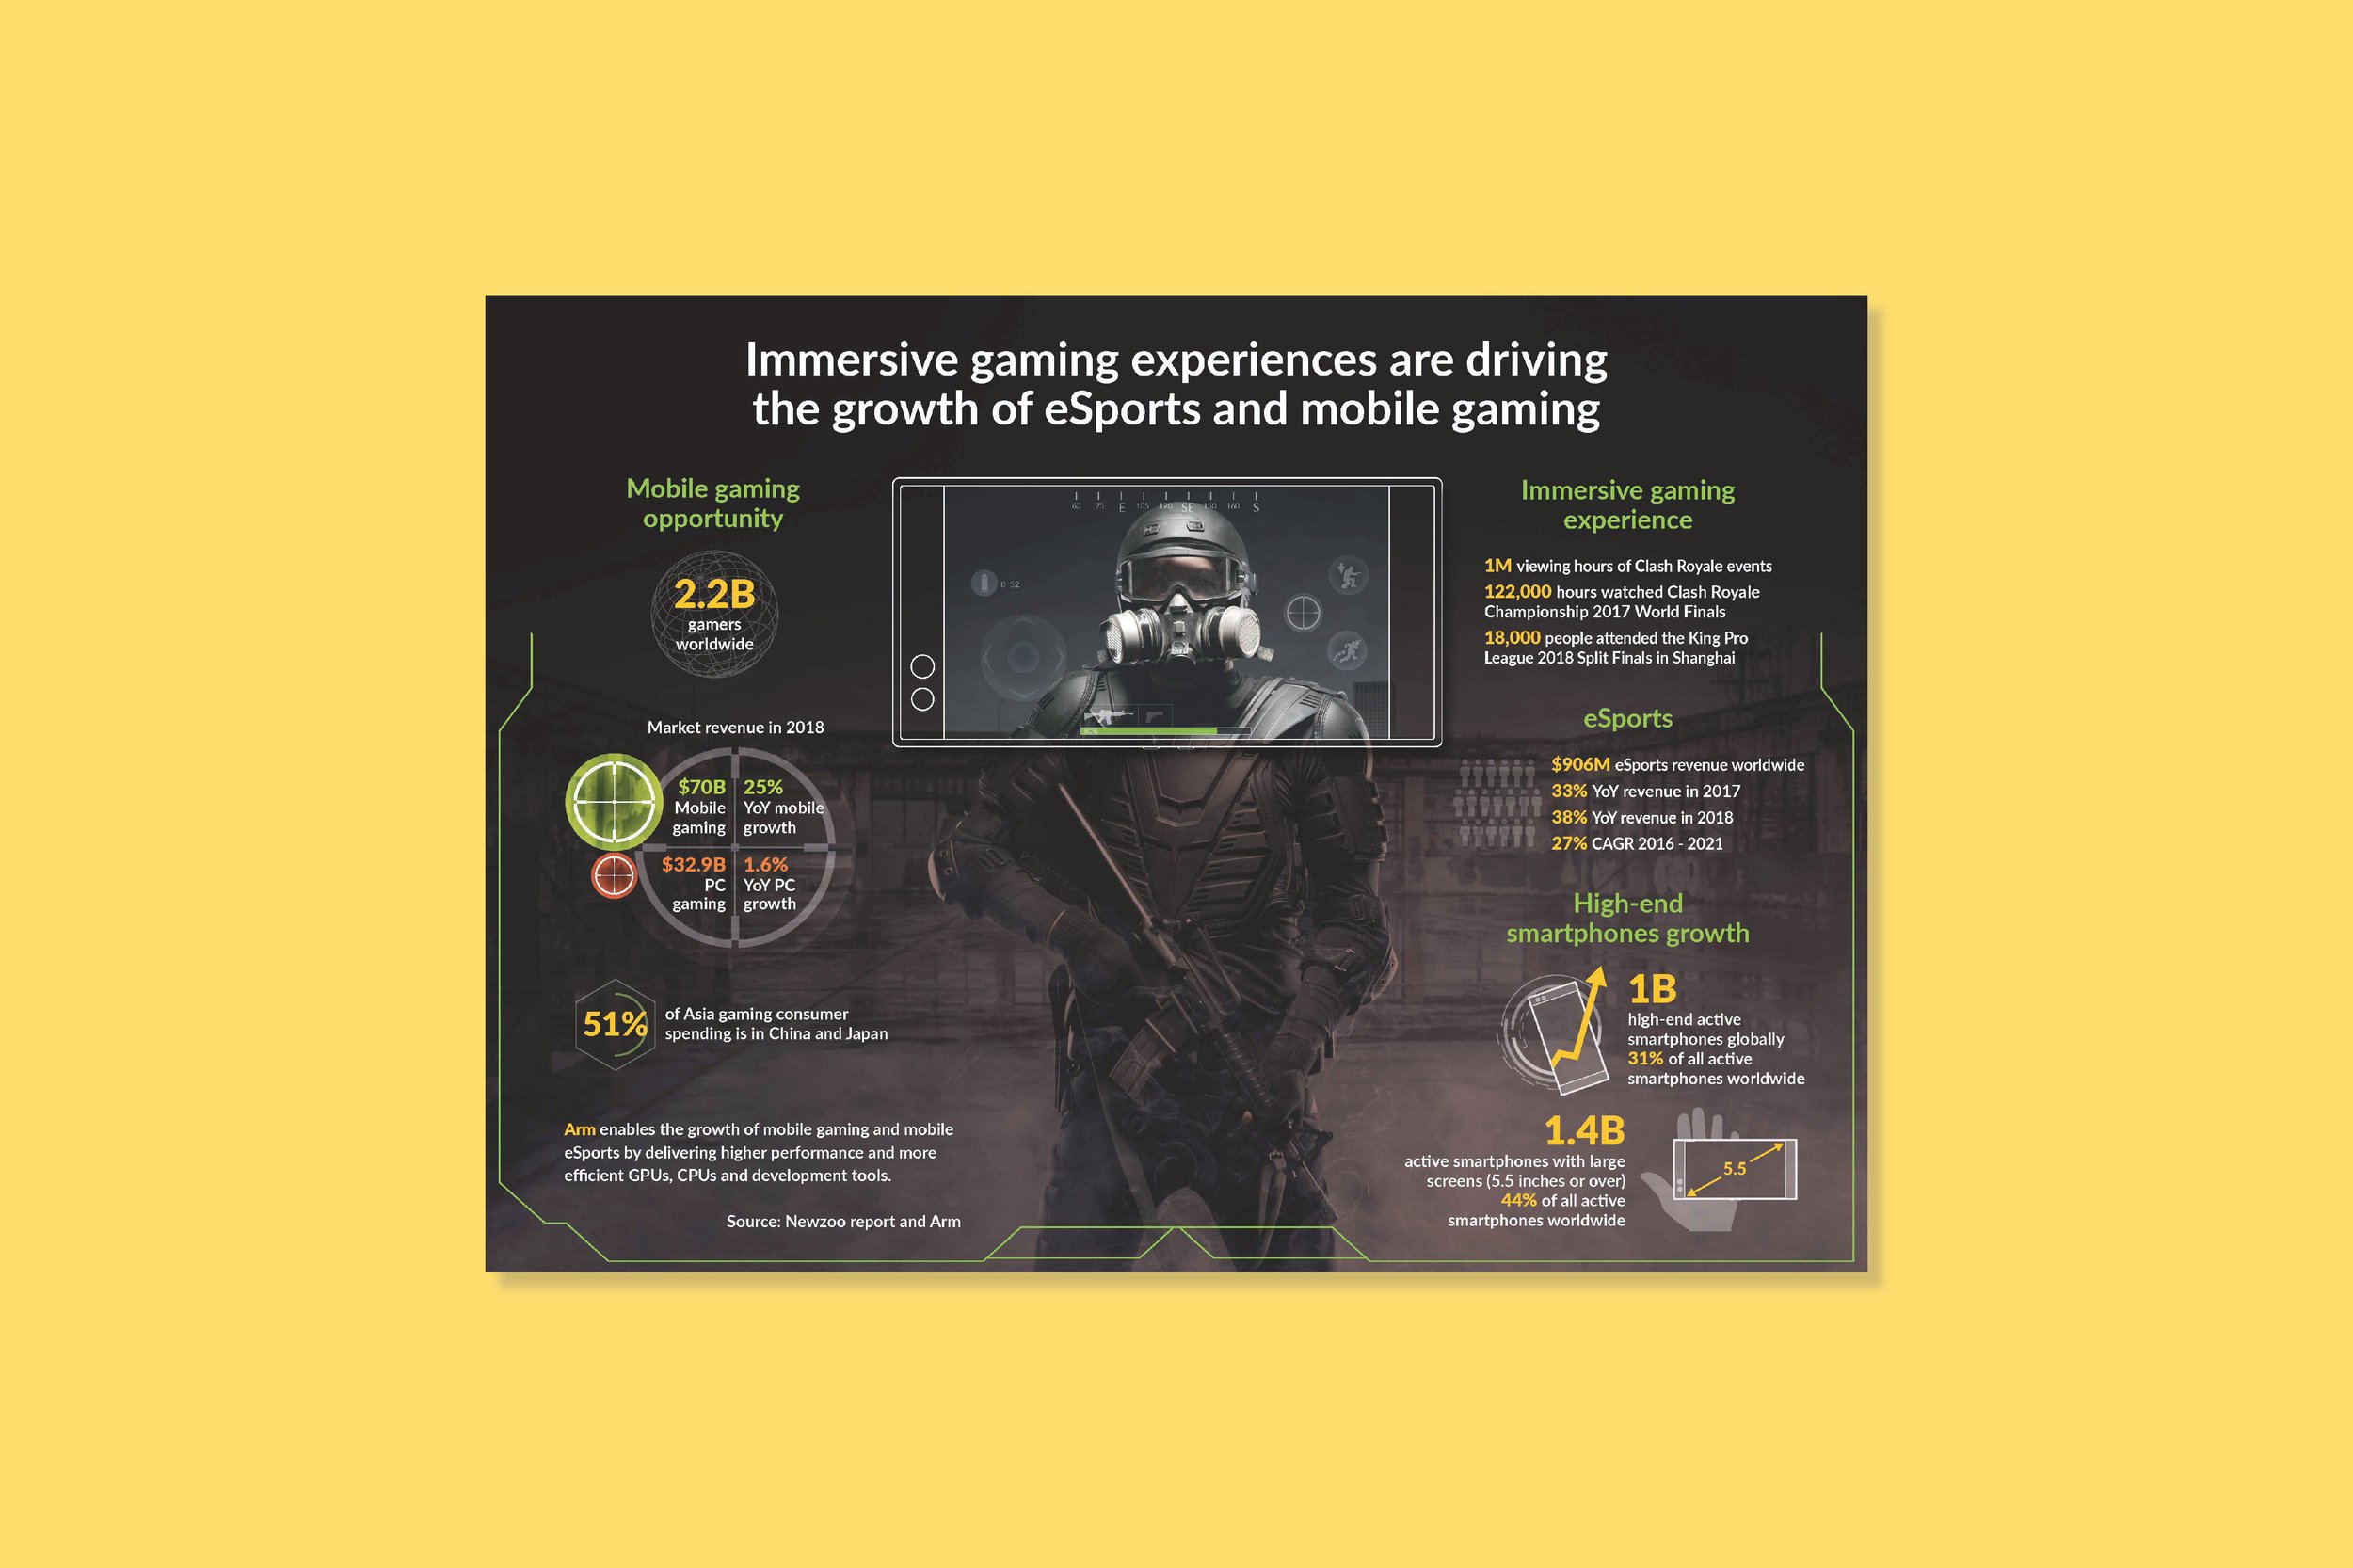
Mobile Gaming Infographics. My task was to dive into the world of eSports and Mobile Gaming, shaping immersive experiences into captivating infographics. Skillfully integrating data, statistics, and insights, I aligned them with ARM's unique brand identity, resonating with the eSports industry. These infographics took center stage in presentations and handouts, successfully communicating the evolution of eSports and Mobile Gaming.
Alameda County
Social Services Agency
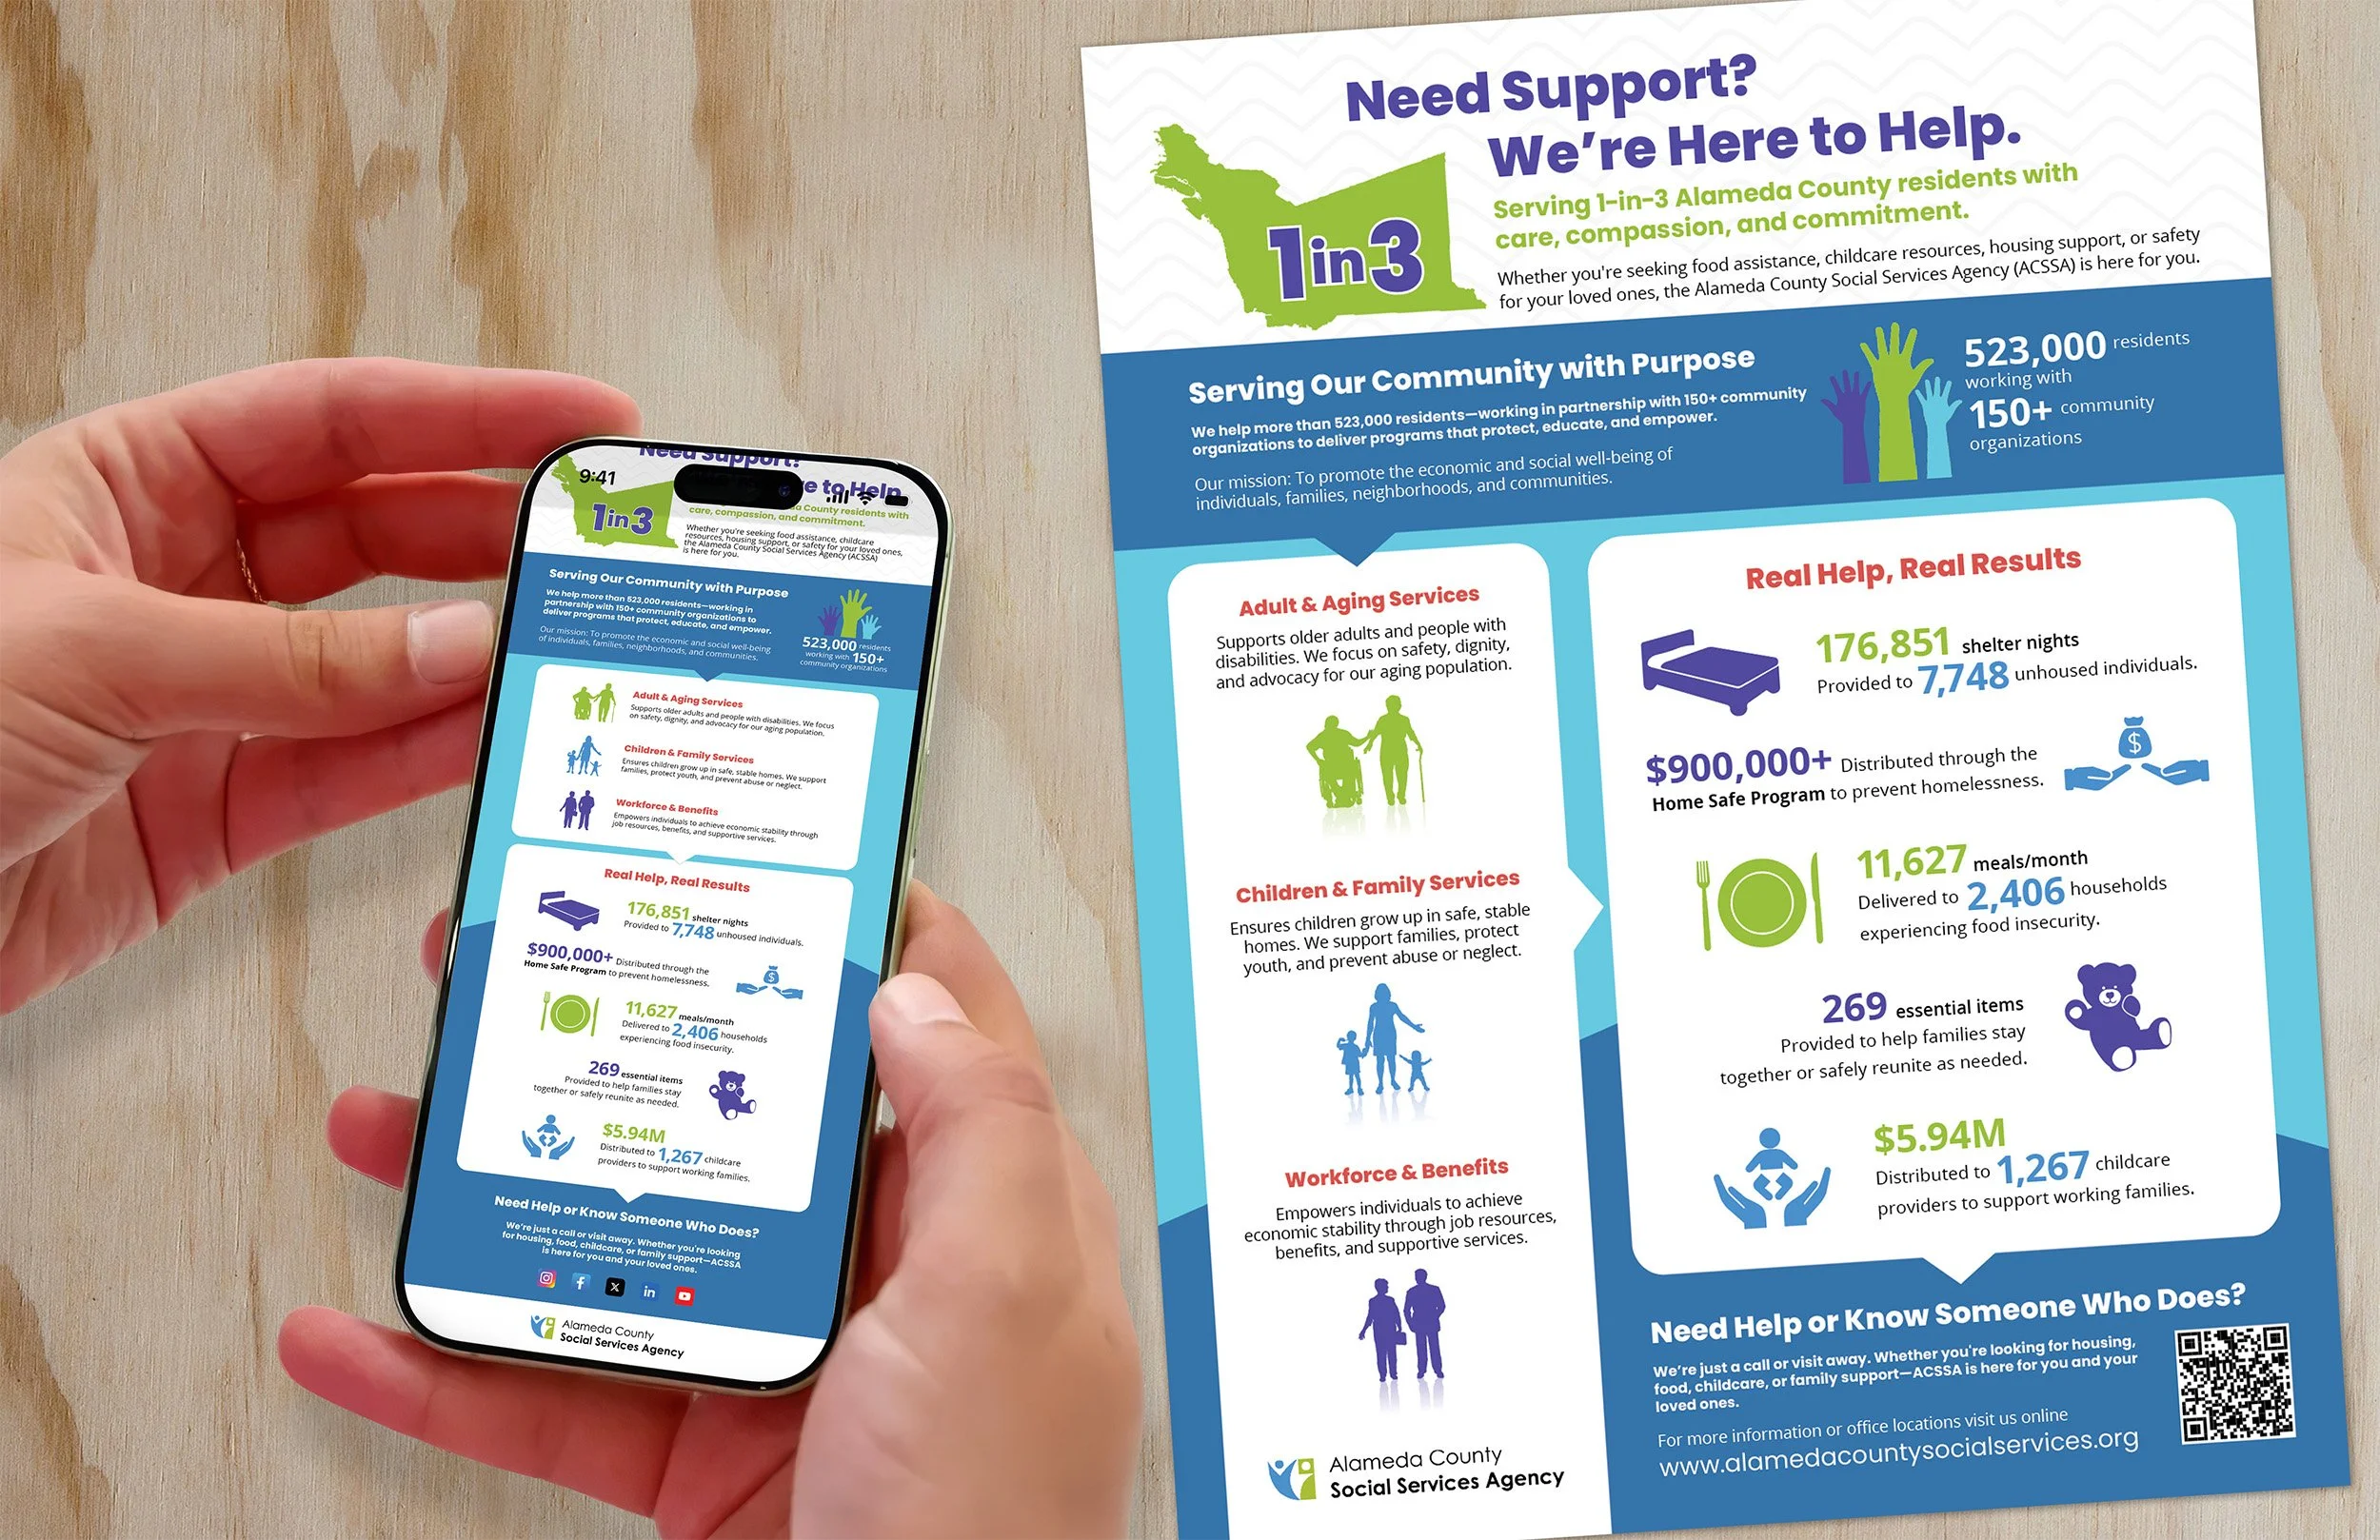
Community Impact Infographic. Designing for public service required translating complex agency-wide data into a clear, accessible visual narrative. I created a community impact infographic that communicates the scale and reach of Alameda County Social Services Agency in a format that is easy to understand at a glance, while remaining accurate and informative for diverse audiences.
The infographic was developed in two complementary formats: a print-ready layout for PDF distribution, posters, and collateral, and a responsive web version optimized for both desktop and mobile devices. By adapting the hierarchy, layout, and visual pacing for each medium, the design ensures consistent messaging across platforms while maintaining clarity and usability for residents, stakeholders, and community partners..

REAL System VR
QSG and IFU
In the realm of emerging technology, such as the REAL System Rehabilitation VR platform, device setup can be complex and overwhelming for new users. To simplify the experience, I designed both Quick Start Guides (QSGs) and detailed User Manuals (IFUs), creating clear instructional layouts supported by custom vector illustrations that visually guided each step of the setup process.
The Quick Start Guide was crafted to help users get up and running quickly, while the User Manual provided comprehensive documentation for deeper understanding. By combining structured layouts with purpose-built diagrams, I ensured users could confidently navigate and operate this innovative medical technology.

ARM Presentation
Inforgraphics
Simplifying Complex Technology: Our infographic, created under the Arm brand, offers a smart solution for explaining the intricate Arm Pelion IoT platform. It's designed to minimize text and rely on visuals, making it easy for presenters to guide their audience through the technology without getting bogged down in wordy explanations. With this approach, we've tackled the challenge of simplifying complex concepts and ensuring our audience can effortlessly understand Device-to-Data connectivity.